Drawing inspiration from popular stories on our social media channels, as well as unique and quirky research news, this monthly column aims to bring you the best of the Earth and planetary sciences from around the web.
Major Stories
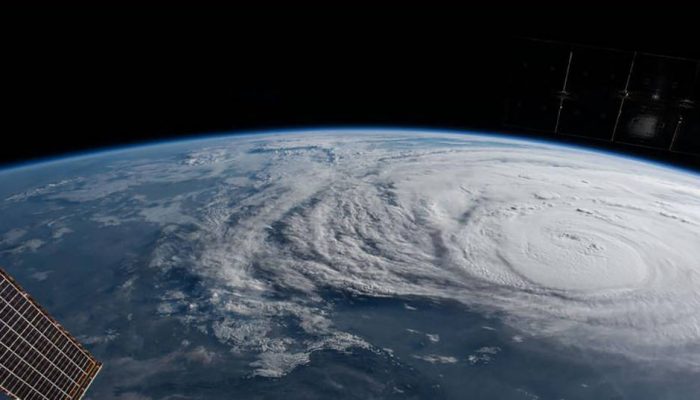
On August 25th Hurricane Harvey made landfall along the southern coast of the U.S.A, bringing record breaking rainfall, widespread flooding and a natural disaster on a scale not seen in the country for a long time. In fact, it’s the first time since 2005 a major hurricane has threatened mainland U.S.A. – a record long period.
But Harvey’s story began long before it brought destruction to Texas and Louisiana.
On August 17th,the National Space Agency (NASA) satellite’s first spotted a tropical depression forming off the coast of the Lesser Antilles. From there the storm moved into the eastern Caribbean and was upgraded to Tropical Storm Harvey where it already started dropping very heavy rainfall. By August 21st, it had fragmented into disorganised thunderstorms and was spotted near Honduras, where heavy local rainfall and gusty winds were predicted.
Over the next few days the remnants of the storm travelled westwards towards Nicaragua, Honduras, Belize and the Yucatan Peninsula. Forecasters predicted that, owing to warm waters of the Gulf of Mexico and favorable vertical wind shear, there was a high chance the system could reform once it moved into the Bay of Campeche (in the southern area of the Gulf of Mexico) on August 23rd. By August 24th data acquired with NASA satellites showed Harvey had began to intensify and reorganise. Heavy rainfall was found in the system.
Harvey continued to strengthen as it traveled across the Gulf of Mexico and weather warnings were issued for the central coast of Texas. Citizens were told to expect life-threatening storm surges and freshwater flooding. On August 25th, Harvey was upgraded to a devastating Category 4 hurricane, when sustained wind speeds topped 215 kph.
Since making landfall on Friday and stalling over Texas (Louisiana is also affected) – despite being downgraded to a tropical storm as it weakened – it has broken records of it’s own. “No hurricane, typhoon, or tropical storm, in all of recorded history, has dropped as much water on a single major city as Hurricane Harvey is in the process of doing right now in Houston (Texas)”, reports Forbes. In fact, the National Weather Service had to update the colour charts on their graphics in order to effectively map it. This visualisation maps Harvey’s destructive path through Texas.
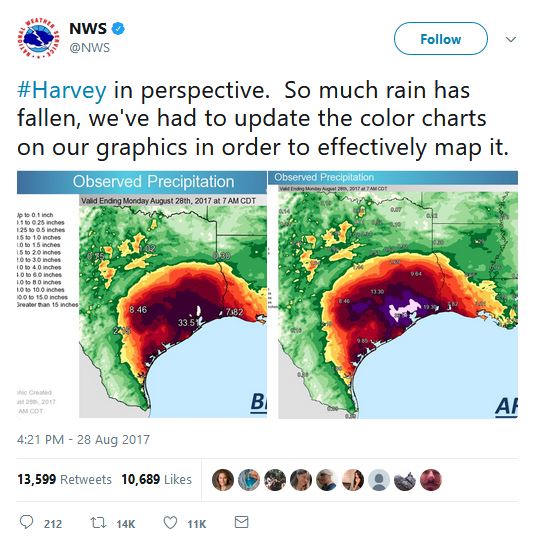
A snaptshot from the tweet by the official Twitter account for NOAA’s National Weather Service.
So far the death toll is reported to be between 15 to 23 people, with the Houston Police Chief saying 30,000 people are expected to need temporary shelter and 2,000 people in the city had to be rescued by emergency services (figures correct at time of writing).
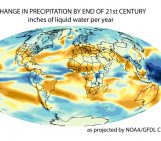
Many factors contributed toward making Hurricane Harvey so destructive. “The steering currents that would normally lift it out of that region aren’t there,” J. Marshall Shepherd, director of the atmospheric sciences program at the University of Georgia, told the New York Times. The storm surge has blocked much of the drainage which would take rainfall away from inland areas. And while it isn’t possible to say climate change caused the hurricane, “it has contributed to making it worse”, says Michael E Mann. The director of the Earth System Science Center at Pennsylvania State University argues that rising sea levels and ocean water temperatures in the region (brought about by climate change) contributed to greater rainfall and flooding.
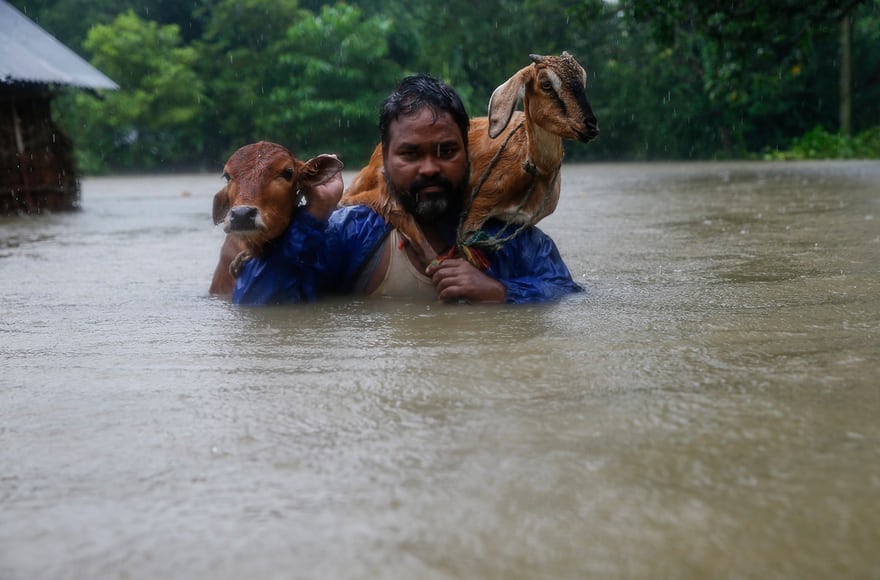
A man carries his cattle on his shoulder as he moves to safer ground at Topa village in Saptari. Credit: The Guardian.
While all eyes are on Houston, India, Bangladesh and Nepal are also suffering the consequences of devastating flooding brought about a strong monsoon. The United Nations estimates that 41 million people are affected by the disaster across the three countires. Over 1200 people are reported dead. Authorities are stuggling with the scale of the humanitarian crisis: “Their most urgent concern is to accessing safe water and sanitation facilities,” the UN Office for the Coordination of Humanitarian Affairs (OCHA) said earlier this week, citing national authorities. And its not only people at risk. Indian authorities reported large swathes of a famous wildlife reserve park have been destroyed. In Mumbai, the downpour caused a building to collapse killing 12 people and up to 25 more are feared trapped.Photo galleries give a sense of the scale of the disaster.

Districts affected by flooding. Credit: Guardian graphic | Source: ReliefWeb. Data as of 29 August 2017
What you might have missed
In fact, it’s highly unlikely you missed the coverage of this month’s total solar eclipse over much of Northern America. But on account of it being the second biggest story this month, we felt it couldn’t be left out of the round-up. We particularly like this photo gallery which boasts some spectacular images of the astronomical event.

This composite image, made from seven frames, shows the International Space Station, with a crew of six onboard, as it transits the Sun at roughly five miles per second during a partial solar eclipse, Monday, Aug. 21, 2017 near Banner, Wyoming. Credit: (NASA/Joel Kowsky)
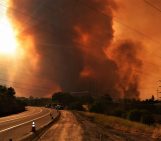
Since the end of July, wildfires have been raging in southwest Greenland. While small scale fires are not unheard of on the island otherwise known for its thick ice cap and deep fjords, the fires this month are estimated to extend over 1,200 hectares. What started the fires remains unknown, as do the fuel sources and the long-term impacts of the burn.
The U.S.A’s National Oceanic and Atmospheric Administration highlighted that the fires are a source of sooty “black carbon”. As the ash falls on the pristine white ice sheet, it turns the surface black, which can make it melt faster. Greenland police recently reported that unexpected rain haf all but extinguished the massive fires; though the situation continues to be monitored, as smouldering patches run the risk of reigniting the flames.
Links we liked
- This is from back in July, but extremely timely given the events in Texas: Attributing extreme weather to climate change
- A view of Earth from space shows that even in the middle of summer, snow still blankets most of the slopes surrounding Crater Lake
- To date, humans have created about 9.1 billion tonnes of plastic, much of which has ended up in landfill
- First-ever global soil erosivity map shows regional differences: Tropics most prone to soil erosion
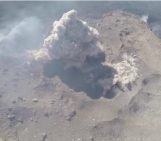
- There are almost 100 new volcanoes hiding under Antarctic ice!
The EGU story
Do you enjoy the EGU’s annual General Assembly but wish you could play a more active role in shaping the scientific programme? Now is your chance! Help shape the scientific programme of EGU 2018.
From today, until 8 Sep 2017, you can suggest:
- Sessions (with conveners and description), or;
- Modifications to the existing skeleton programme sessions
- NEW! Suggestions for Short courses (SC) will also take place during this period
- From now until 18 January 2018, propose Townhall and splinter meetings
And don’t forget! To stay abreast of all the EGU’s events and activities, from highlighting papers published in our open access journals to providing news relating to EGU’s scientific divisions and meetings, including the General Assembly, subscribe to receive our monthly newsletter.
